Hate Estimating? Try doing a User Story Map instead

There is no shortage of people who loathe estimating software projects. Business folks love certainty. They always want to know how much something is going to cost and how long will it take. Software Engineers, not so much. We’ve been burned so many times giving someone our best “guess,” only for them to hold it as a commitment against us.
I see both sides of the story here.
Let’s talk about a better approach – User Story Mapping and Forecasting.
I have used this approach a few times now and have turned something I really despise doing into something I rather enjoy.
Step 1 – Collect as much information as possible to understand what is needed
To get started, you need to have conversation with someone who wants to build something. You need to ask as many questions as possible to understand their goals and expectations for the product. It’s possible that a requirements document may end up on your lap. That’s fine too, but after you read it, definitely have the conversation.
Important: We aren’t trying to get into the gory details with the level of estimating we are doing here. It’s totally ok that somethings are undefined or uncertain. We will learn how to manage that in a bit.
Step 2 – Build a User Story Map
This is where it gets fun.
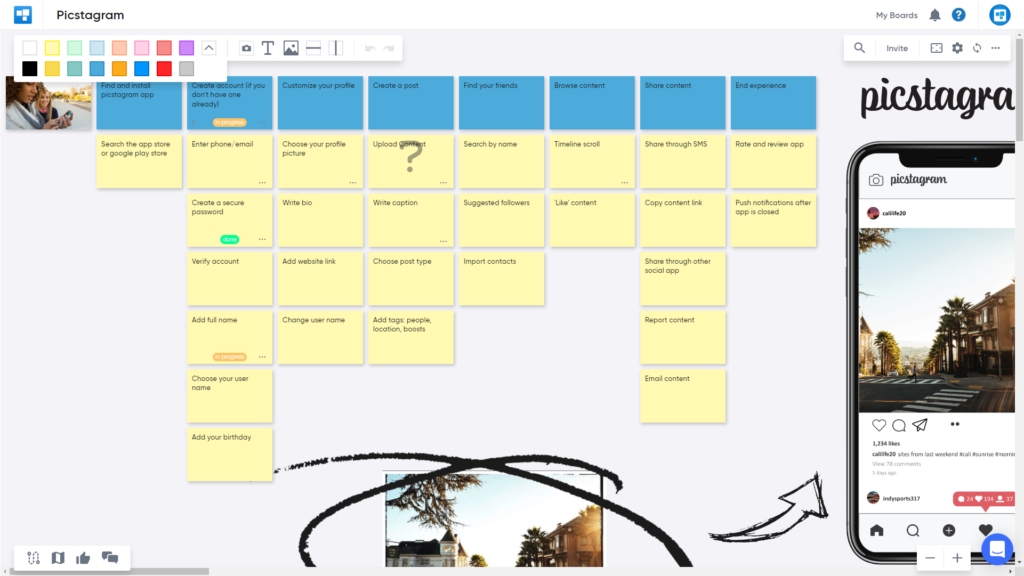
Personally, I love building user story maps. It works for me because I’m a visual thinker (a picture >= 1000 words). After we talk to our customer about what they want to build, we start to build a User Story Map using CardBoard.
We look to decompose the problem down into manageable chunks and don’t get caught up in the minutiae of the details. Let’s capture the stories of the different personas of an orthopedic medical device.
Next, we make sure we outline every screen that needs to be developed and anything of importance outside the UI. After all of this, we have understanding of what is needed to be built. I’m sure we missed some things, but that’s ok, the forecasting tool will help with this.

Step 3 – Add it up
Most people in our industry either use effort estimates (hours/man-days) or story points to estimate the work once it is broken down. There are a couple of options that I like better:
- T-shirt sizing
- Counts
T-shirt sizing is fairly straight-forward. For each task, you choose from a small set of estimation values. For example, small, medium, large and extra large. This can simplify things since you don’t have to worry about numbers. Instead you are giving each task a T-shirt size based on how it compares to the other tasks.
My favorite thing to use is counts. Here you are assuming that each task is roughly the same size, so you are just counting the total number of tasks and multiplying it by some factor to get the estimate.
Some may say this approach is crazy. There is just too much variance to assume every task you have broken down is the same size. I thought the same thing, but the data shows that it doesn’t matter that much.
The reality is that a majority of your stories will average out to a certain number with little variance if you can break them down into understandable pieces of work.
Step 4 – Forecast it
The best part of this whole process is using a forecasting tool built by Troy Magennis. You can download the tool from here.
The tool uses Monte Carlo simulations to give you a date range of when you will be done. And more importantly, a certainty with each date.
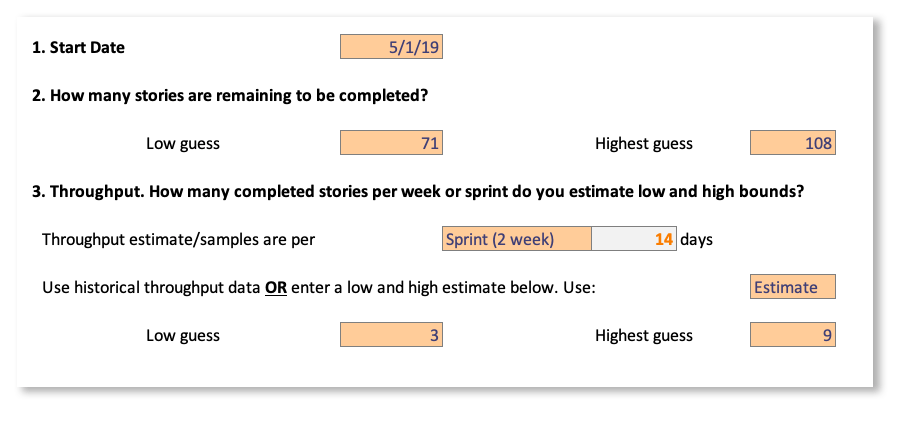
To start with your forecast, enter in the following parameters in the Forecast tab:
- Start date – When you think you will begin
- Low guess – For this, I counted the number of stories in my User Story Map
- High guess – This number includes my contingency for rework, bugs, uncovered scope (in other words, risk has materialized)
- How many days are in your Sprints (or iterations)
- A Low guess for how many stories you will get done in a Sprint
- A High guess for how many stories you will get done in a Sprint

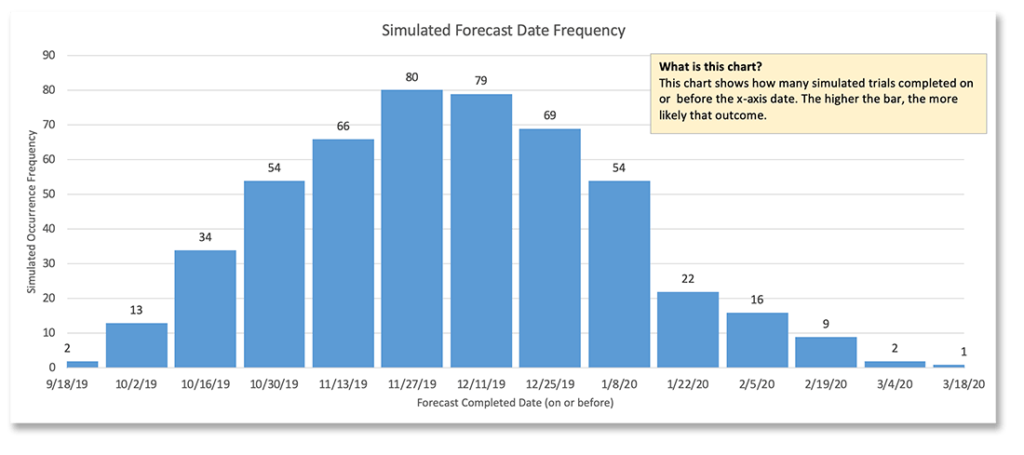
After we enter this data, the tool runs 500 simulations for the project and collects the outcomes. Here we see a histogram of the number of times a simulation finished on a particular date. For example, 80 simulations finished on 11/27/2019.

The other view we get from the tool shows the certainty or likelihood of the project finishing on a date in a nice table format. When I want to answer the question for someone “when will you be finished?,” this is the piece of information I bring with me to that conversation.
My goal is to communicate, not a date, but a range of dates where we might finish. I rarely use the less than 50% dates. This only happens if the project is small, we don’t have dependencies and we know there is low risk.

Most projects will fall in the 50% – 90% range.
This is what I budget and plan for. I tend to want to under promise and over deliver, so I usually give folks more conservative estimates. I do this because I know things are going to happen in software development. We are going to have moments where something doesn’t go our way. But that’s okay, because the forecasting tool will help us take this into account.
We adapt and move on.
Summing it up
The other big thing to keep in mind is that people won’t stop asking you “When is it going to be done?” During the project, people expect to know how changes and unplanned work impact the “done” date. That’s what I love about this process and the tools I use. We can update our User Story Maps as we learn more and then feed that into the forecasting tool.
Weather forecasts can change all the time, so shouldn’t our forecasts for software products do that same? Don’t give a single date at the beginning of the project. Instead, give a range and update that range as things change. Last, keep people informed by communicating your forecast.
Didn’t find what you need? Visit our Help Center to find answers or get in contact with our team.
Ready to try CardBoard for yourself? Sign up to start your 14 day free trial!
[author]
